Dry van long-haul cost forecast falls to 4% y/y growth

U.S. spot market forecast
The C.H. Robinson 2025 truckload dry van long-haul cost forecast is shifting from 7% year over year (y/y) growth to 4% y/y growth. This cut is in response to emerging U.S. tariff policies as a growth headwind. There has been some pull-forward of imports ahead of the tariffs, first from companies, and now consumers are pre-buying goods ahead of price increases (which are starting to appear).
The C.H. Robinson forecast change is based on the belief that the pull-forward of imports is mostly over and consumer pre-buying will slow as inventories of lower cost, pre-tariff goods, are depleted.
Price hikes on U.S. goods will hurt demand for goods and the same dynamic will impact exports due to the reciprocal tariffs. Lower demand for goods will place downward pressure on freight volumes.
The first release of the U.S. Real GDP in the first quarter of 2025 captured this import pull forward dynamic as it declined by 0.3% on an annualized basis. The increase in imports was a 5% drag on GDP growth while domestic inventory builds (presumably driven by these imports) helped GDP by 2.3%. These both tend to be choppy and closer to zero. Backing out these one-time impacts would land GDP growth in Q1 2025 at around 2%.
This is a little below the 2.5–3% growth experienced in recent quarters but is in-line with the two decades leading up to the COVID-19 pandemic. Growth in consumer spending slowed meaningfully in Q1, more so on goods versus services, which will be important to monitor from a freight perspective.
Ultimately, it’s impossible to know how the tariff policies will settle, but one of the primary goals of these tariffs is to reduce the United States’ trade deficit with some of the country’s largest trading partners. Once there is clarity on where tariffs land, supply chains will reconfigure to match the policy. The magnitude and breadth of tariff policies will determine how much supply chains will change.
Due to our vast network density, breadth of offerings, and information advantage, C.H. Robinson is perfectly positioned to successfully navigate these, and other, supply chain shifts.
Dry van forecast
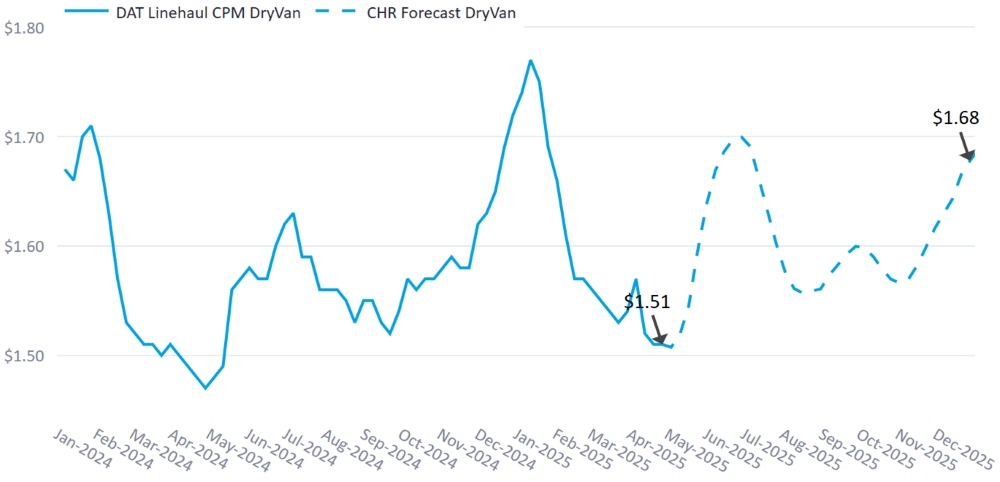
The C.H. Robinson 2025 dry van cost per mile forecast has been cut from +7% to now be +4% y/y.
Refrigerated truckload forecast
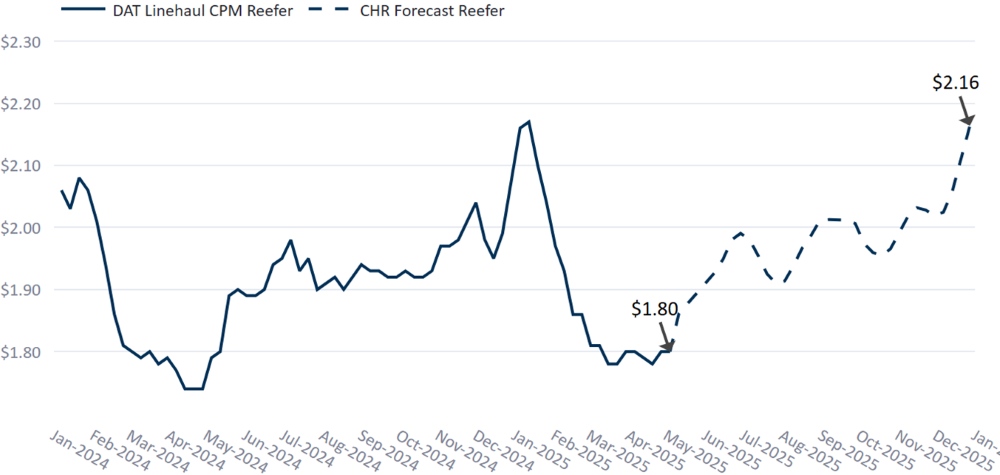
The C.H. Robinson 2025 refrigerated van cost per mile forecast has been cut from +5% to now be +/-0% y/y.
Roadcheck week
International Roadcheck Week is a three-day annual event. This year it occurs between May 13–15, 2025, across North America. During this period, CVSA-certified inspectors perform widespread compliance checks, inspecting an average of 15 trucks and motorcoaches every minute.
These inspections often lead to reduced truck availability, as time spent undergoing inspections cuts into drivers’ hours of service. Given the event's scale, these time losses accumulate quickly. Additionally, some vehicles may be temporarily taken out of service if found non-compliant, further tightening capacity.
DAT’s dry van load-to-truck ratio (LTR) data spanning 15 years shows exactly how Roadcheck Week affects the market.
DOT Roadcheck Load: Truck Ratio Impact
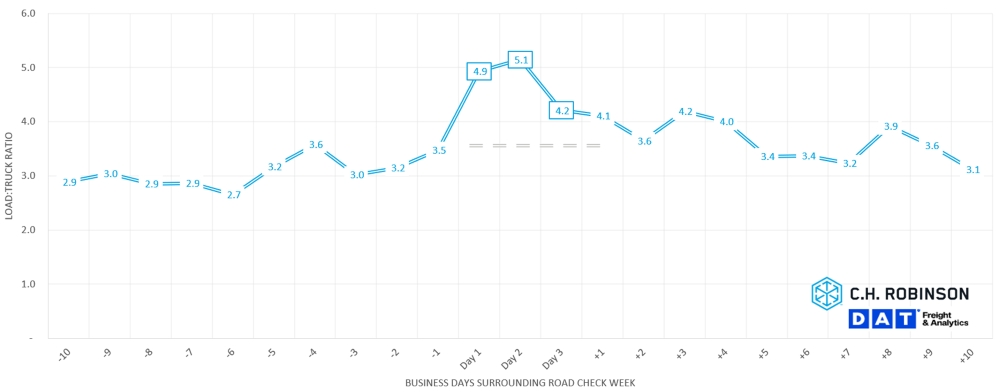
Historically, LTRs increase significantly during the three-day event, tightening 40–60% week-over-week. The impact doesn’t end there; the day after the event, the market often experiences an aftershock, with LTRs up more than 30% week-over-week.
While other factors, like produce season or holidays, can sometimes overlap and influence these trends, Roadcheck Week is typically the main driver of the shift during these days. With the new executive order around enforcement of the English language proficiency standards for drivers, and the current unknowns of enforcement, there could be a reluctance from some drivers to take to the road during Roadcheck week. While broadly the impacts are expected to be minimal, concentrated areas of immigrant populations like Laredo, TX, could be impacted more than others.
Recognizing the disruption is only part of the equation, the other is planning ahead. Shippers can reduce the impact by allowing for greater flexibility with pickup and delivery times and even adjusting dock hours if needed.
To learn more about how Roadcheck Week may affect your operations, reach out to your C.H. Robinson representative to be connected with the C.H. Robinson capacity team.
Contract truckload environment
The following insights are derived from C.H. Robinson Managed Solutions™, which serves a large portfolio of customers across diverse industries.
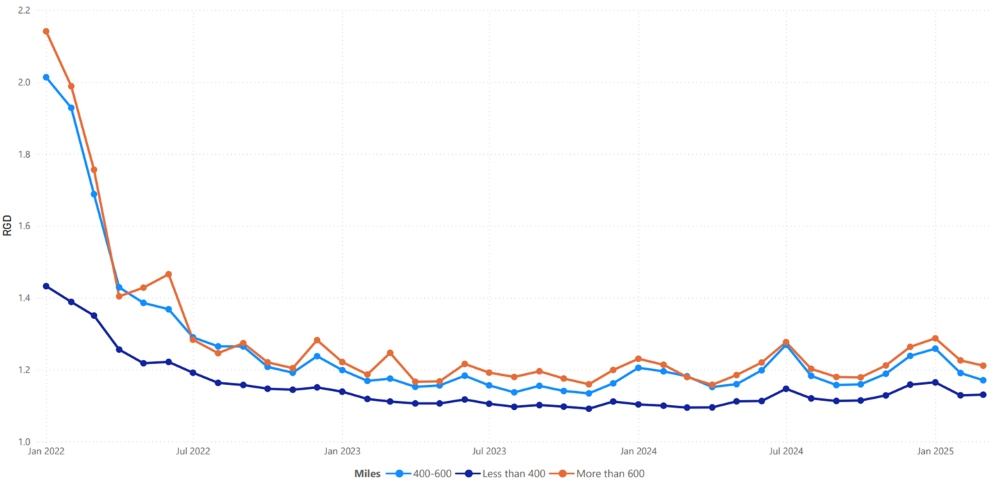
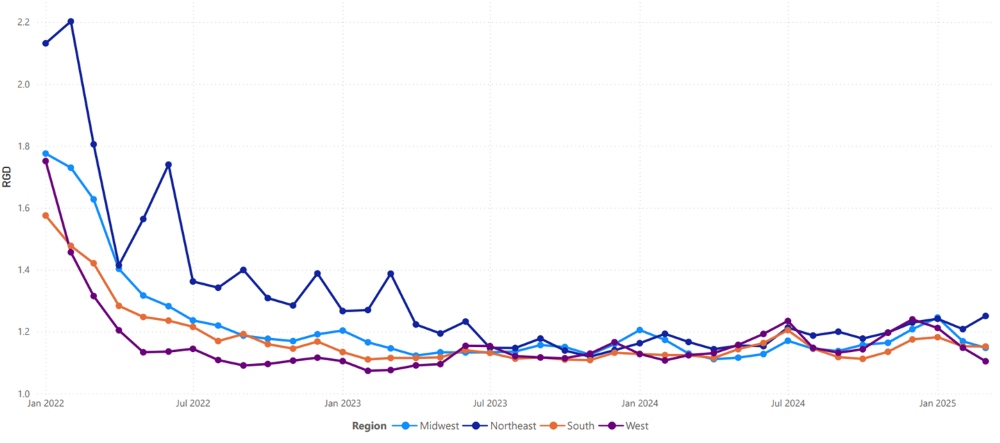
Route guide depth (RGD) is an indicator of how far a shipper needs to go into their backup strategies when awarded transportation providers reject a tender. As displayed in the following chart, the RGD has remained flat at a historically low level for approximately two years.
For long hauls of more than 600 miles, the RGD in April 2025 was 1.22 (1 would be perfect performance and 2 would be extremely poor), which is slightly worse compared to the month of March 2025, at 1.21 and slightly worse compared to April 2024, which was at 1.16.
The trend for shorter hauls of less than 400 miles is similar. RGD for April 2025 on these shorter hauls was 1.14, which is slightly worse compared to the previous month of 1.13 and worse than April 2024 at 1.09.
North America Route Guide Depth Metrics: Miles
Geographically, the West experienced the smallest change of all regions, remaining the same as the previous month, while the Northeast experienced the largest change at 14% worse. The RGD still remains at low levels between 1.10 and 1.26 for all regions.
U.S. Route Guide Depth Metrics: Regions
Refrigerated truckload
Spring brought more than just warm weather to the United States. It also means produce season is in full swing. Produce season marks a critical shift in the U.S. truckload freight markets due to the surge in agricultural shipments starting from southern regions like Mexico, Florida, Texas, and California in the spring then further northward through the summer.
This causes an imbalance of supply and demand, impacting all shippers, not just produce shippers. The seasonal demand for temperature-controlled trailers, coupled with equipment reallocation and increased urgency, tightens capacity across all modes, raises rates, and disrupts routing guides nationwide.
The disruption is further amplified by overlapping seasonal events such as Mother’s Day floral demand, DOT Roadcheck Week, and major holidays like U.S. Memorial Day, Independence Day, and Labor Day, all of which create short-term capacity crunches and market volatility.
Even if you’re not directly involved in produce, plan strategically to maintain service and control costs during this pivotal freight season. There are steps you can take throughout the year to minimize the impact of produce season.
Before the season begins:
- Develop proper demand forecasting
- Clearly communicate expectations with providers
During produce season:
- Provide pickup windows and ample lead time
- Review lane performance and tend to under-performing lanes/carriers
After the season ends:
- Evaluate overall performance
- Implement continuous improvement efforts for next annual cycle
For more information on produce season and strategies to successfully navigate the challenges, read our new produce season blog.
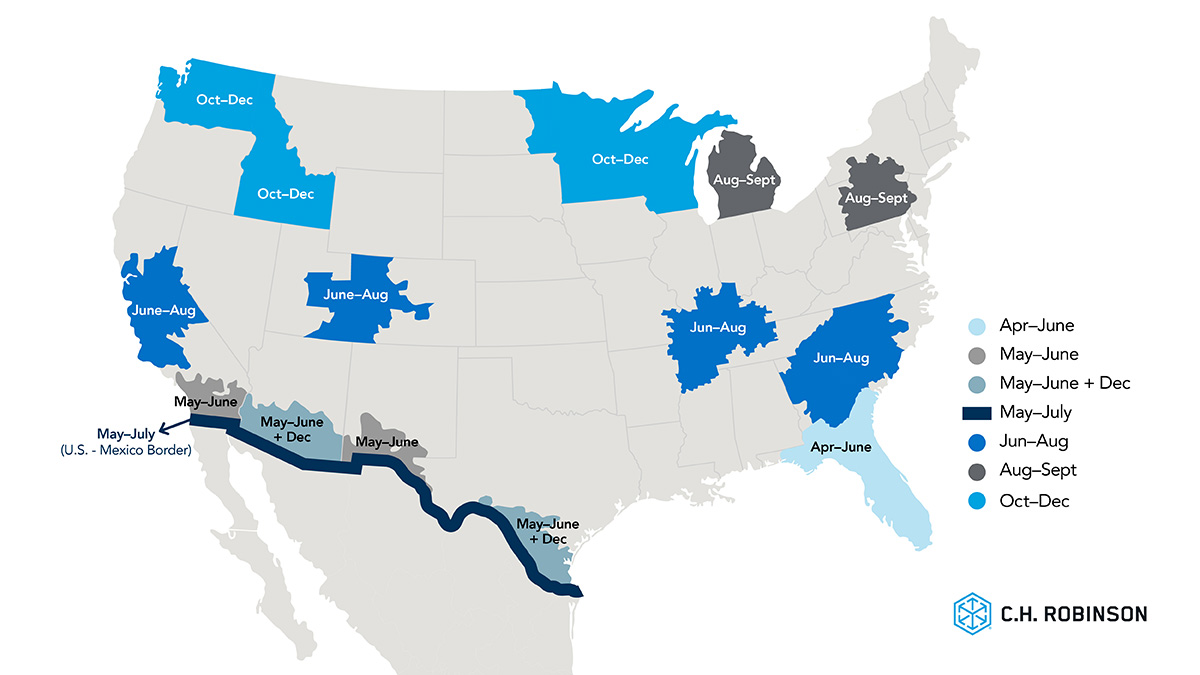
Produce Season Peak Freight Impact
East Coast United States
Watermelons, sweet corn, and tomatoes have been some of the primary commodities shipping in higher volumes out of Florida. This is expected to peak in May and June, and shift northward while volumes increase out of Georgia and the Carolinas (although moderately in May).
Central United States
Broadly speaking, capacity out of the central region has been fairly tempered, with an exception for cross-border freight from Mexico and Southern Texas. Watermelons, tomatoes, grapes, and avocados are among some of the larger volume fruits and vegetables shipping in May and June.
West Coast United States
Southern California and Southern Arizona have seen the most movement from produce season as strawberries, celery, and leafy greens are harvested. Further tightening through May is expected as peak season ramps up, even central California should begin to see some signs of produce shipping from lettuce and strawberries.
Flatbed truckload
While produce season is most commonly associated with refrigerated freight, the spring and early summer surge also has a meaningful impact on flatbed freight markets. This is largely due to the overlap between peak agricultural shipping, capital project mobilization, and the seasonal uptick in demand for construction and landscaping materials, all key sectors that rely heavily on flatbeds.
As the ground thaws and construction activity accelerates across much of the United States, commodities like lumber, rebar, mulch, soil, stone, and steel begin moving in greater volume. Landscaping supplies, like mulch and soil, often move in large batches to retailers, nurseries, and job sites throughout April and May.
The challenge for flatbed shippers isn’t necessarily produce itself, but the shared exposure to broader capacity tightening. There can often be some overlap in trailers that can be used to move a load, so tightening in one mode trickles into others. As other trailers are less available to move general commodities, flatbed carriers simultaneously see an increase in demand from construction booms, landscaping materials, and raw commodities like steel and aluminum.
Carriers repositioning equipment to more lucrative freight in hot regions leads to volatile capacity and fluctuating spot rates. In these markets, spot capacity changes at the daily and hourly level. For those shipping into or near produce-heavy regions (such as the Southeast or southern California), it’s particularly important to plan ahead and coordinate with providers early and often to secure capacity.
Voice of the carrier
Market
- Carriers continue to be challenged by soft demand.
- As the loose market persists, carrier acquisition discussions have become more active.
- Carriers remain focused on driving costs and inefficiencies out of their business, including being more disciplined about charging for additional services like dwell times they may have previously let slide.
Drivers
- Driver applications are currently high, but the perceived quality of some drivers doesn’t always meet standards.
- Retention levels continue to improve for many carriers as drivers look for job security.
- Carriers believe the announced English language proficiency enforcement could be a mild, short-term issue, particularly in communities with significant immigrant populations, especially give enforcement unknowns. Overall, expect market normalization with minimal disruption.
Equipment
- Truck costs are up while trailer costs are down.
- Equipment is still widely available, and replacement trucks are coming in on schedule.
- Many carriers are waiting to understand the impact of tariffs before ordering new equipment.